Make better investing decisions
Why track federal spending?
Federal spending and taxation is the only way to net add or net remove dollars from the economy. This has implications for economic growth and the stock market.
Track the money flows
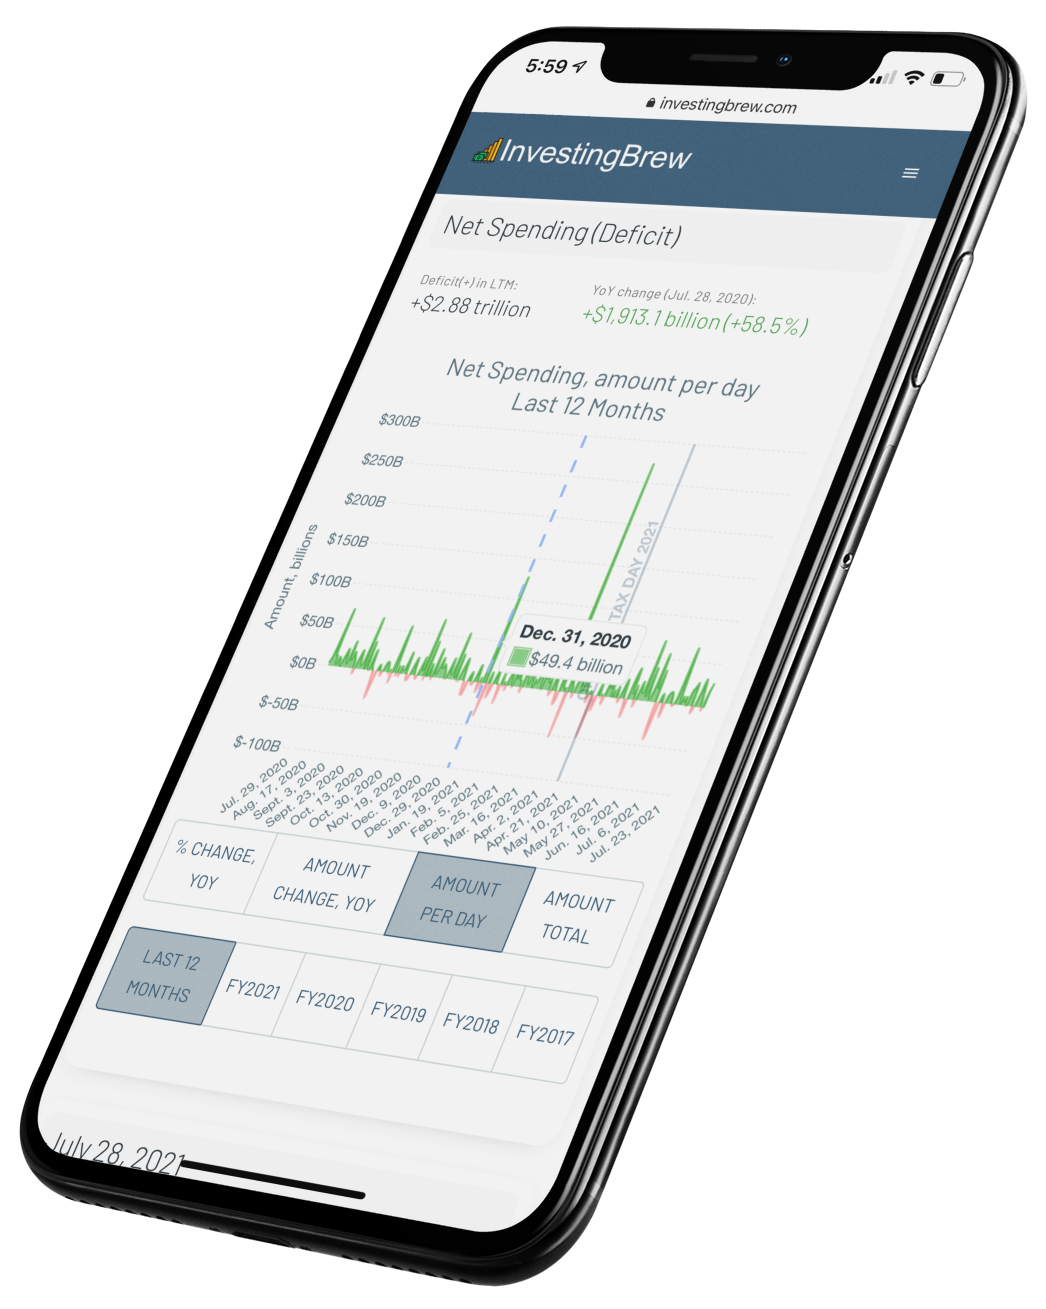
Get a daily update of how many billions of dollars are spent and taxed every day. See where the money is going and identify important year-over-year trends.
Understand the market
Net spending or net taxation growth rates affect growth rates of corporate revenues and profits. Understanding these trends can help identify trends in stock prices.
Get the data delivered to your inbox
Basic
Get a weekly update on federal government spending and revenue, delivered to your inbox every Monday after market close.
FREE
Weekly spending and revenue overview
Fiscal Year spending and revenue overview
Premium
Get a daily update on federal government spending and revenue, including year-over-year data and charts, delivered to your inbox every weekday after market close.
$20
/mo
Daily spending and revenue overview
Last 12 Months spending and revenue overview
Year-over-year data and charts
CBOE Put/Call ratio sentiment indicator
Frequently Asked Questions
What is Investing Brew?
Investing Brew is an automated subscription data service for stock market investors that I created in my spare time. After studying the stock market, the U.S. monetary system and Modern Monetary Theory over the last three years, I realized there is only a small set of data points that are the most important for understanding the current state of the stock market from a macro perspective. So I created an automated data service that I wish existed that conveniently tracks these data points and emails out a daily summary.
What does the product offer?
Federal government spending data from the Treasury can be time-consuming to analyze. Investing Brew offers a web app and an automated email service to conveniently track the most important data points, with a free tier and a premium tier. The free tier gives a overall look at federal government spending on a weekly basis and the premium tier offers additional charts and daily updates. The web app updates once a day as soon as new data is released. Automated email updates go out every day within 30 minutes after market close.
Why is federal government spending one of the most important data points?
Federal government spending and taxation is one of the most important data points because it's the only mechanism whereby net new money can be spent into the economy (deficit spending) or removed from the economy through taxes (surplus). Congress (through the Treasury) is the only entity that can do this. Bank lending and Federal Reserve operations do not net spend or net remove money. Net spending or net taxation trends have implications for the revenues and profits of corporations and therefore their stock prices.
What insight can I gain from federal government spending and taxation data?
The most important insight can be gained from absolute and year-over-year trends in spending and taxation. For example, if net spending is increasing year-over-year, that means the private sector in the aggregate has more money to spend compared to a year ago. This translates to increased revenues and profits for corporations where the money is spent and therefore higher stock prices for those corporations. We are fortunate that the government publishes this data openly.
What other data sources does Investing Brew track?
In addition to federal government spending and taxation data, Investing Brew also tracks CBOE put/call ratio data to provide a sense of current market sentiment, as expressed by options traders.
Where does the data come from?
Federal government spending and revenue data is published daily by the Treasury. Put/call ratio data is published daily by CBOE. We are lucky
